Technical Analysis for Gift Card Traders: Recognizing Price Patterns and Timing Your Market Entries
Technical Analysis for Gift Card Traders
While gift card markets differ from traditional financial markets, many technical analysis principles apply directly to optimizing trading decisions. Understanding price patterns, seasonal trends, and market indicators enables traders to time entries and exits for maximum profitability.
Foundations of Gift Card Price Analysis
Gift card pricing follows observable patterns driven by supply dynamics, consumer demand cycles, and external market factors. Recognizing these patterns transforms reactive trading into strategic positioning.
Unlike stock markets with continuous price feeds, gift card markets operate with discrete pricing updates. This characteristic means traders must aggregate data over time periods to identify meaningful trends. Daily or weekly price averages provide more actionable signals than individual transaction prices.
Seasonal Pattern Recognition
Gift card markets exhibit pronounced seasonal patterns that repeat with reasonable consistency year over year. Learning to anticipate these patterns provides significant trading advantages.
Holiday Season Surge (November through January)
The period from late November through early January represents peak gift card activity. Retail gift cards experience maximum demand as holiday shoppers purchase gifts. Gaming cards spike with major console and game releases timed for holiday sales. This period typically sees prices rise across most categories as supply struggles to meet demand.
Trading Strategy: Build inventory in October when prices remain moderate. Sell aggressively during the December peak when buyers accept higher prices. Avoid accumulating new inventory in late December as post-holiday price declines begin.
Post-Holiday Correction (January through February)
Recipients of unwanted gift cards flood secondary markets in early January. Supply increases substantially while buyer demand decreases following holiday spending exhaustion. Prices typically decline ten to twenty percent across most categories during this correction period.
Trading Strategy: Reduce inventory exposure before January arrives. Maintain cash reserves to purchase discounted cards from motivated sellers. Patient buyers can acquire inventory at seasonal lows for holding until demand recovers.
Spring Recovery (March through May)
Markets stabilize as post-holiday excess inventory clears. Graduation season creates demand for retail and restaurant gift cards. Travel cards experience increased interest as vacation planning begins.
Trading Strategy: Gradually rebuild positions as prices stabilize. Target cards aligned with graduation gifting (retail, dining, entertainment). Consider travel category exposure ahead of summer vacation season.
Summer Plateau (June through August)
Gift card markets typically experience reduced activity during summer months. Neither significant demand drivers nor major supply increases characterize this period. Prices tend to remain relatively stable with reduced trading volumes.
Trading Strategy: Maintain existing positions without aggressive expansion. Use reduced competition to negotiate favorable rates on high-quality inventory. Prepare positioning for back-to-school and holiday seasons.
Pre-Holiday Accumulation (September through October)
Sophisticated traders begin positioning for holiday demand during autumn. Early accumulation enables better pricing than last-minute purchases when competition intensifies.
Trading Strategy: Begin systematic inventory building across anticipated holiday demand categories. Prioritize gaming cards ahead of major fall release schedules. Monitor promotional pricing from retailers that may increase supply availability.
Trend Identification Techniques
Beyond seasonal patterns, traders can identify short-term and medium-term trends within specific card categories.
Moving Average Analysis
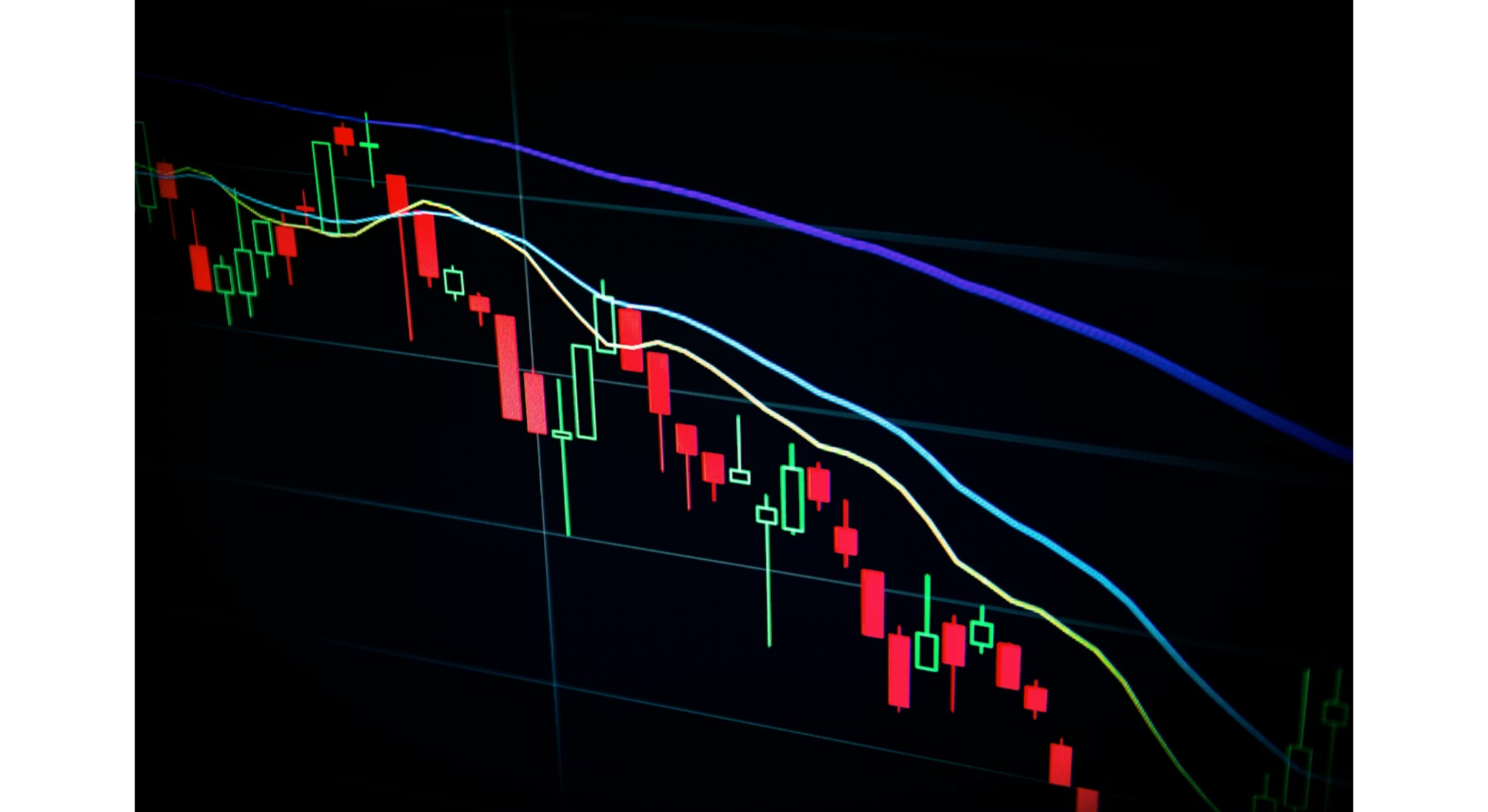
Calculate rolling averages of recent transaction prices to smooth daily volatility and reveal underlying trends. A seven-day moving average crossing above a thirty-day moving average often signals strengthening prices. The reverse crossover may indicate weakening demand.
Apply this technique to cards you trade regularly, tracking your own transaction data alongside market observations. Personal trading data often provides more relevant signals than aggregate market statistics.
Volume-Price Correlation
When transaction volumes increase alongside rising prices, the trend typically has momentum. Rising prices on declining volumes may indicate unsustainable gains. Falling prices with high volumes suggest strong selling pressure likely to continue.
Monitor platform activity indicators and community discussions to gauge volume trends when direct data is unavailable.
Entry and Exit Timing
Optimal timing separates profitable traders from those who merely break even. Several principles guide timing decisions.
Buy on Weakness, Sell on Strength
Counter-intuitive for beginners, this principle produces consistent results. Purchase when prices dip below recent averages, assuming fundamental value remains intact. Sell when prices exceed typical ranges, capturing premium pricing before inevitable corrections.
Avoid Chasing Momentum
When prices spike rapidly, resist the urge to buy at elevated levels hoping for continued gains. Late entries at peak prices frequently result in holding losses when corrections arrive. Wait for pullbacks to enter positions at favorable prices.
Scale In and Scale Out
Rather than committing full position size at single price points, divide entries and exits across multiple transactions. This approach reduces timing risk and provides flexibility to adjust as market conditions evolve.
Data Collection and Analysis
Effective technical analysis requires systematic data collection. Establish routines for tracking relevant metrics.
Maintain records of your transaction prices, dates, and volumes. Track competitor pricing across multiple platforms. Note external events that correlate with price movements (retailer promotions, game releases, economic news).
Spreadsheet analysis or simple charting tools enable pattern visualization that raw numbers may obscure. Even basic trend lines reveal insights not apparent from casual observation.
Limitations and Considerations
Technical analysis provides probabilistic guidance rather than certainty. Gift card markets can experience disruptions that invalidate historical patterns. Retailer policy changes, fraud incidents, or economic shocks may temporarily or permanently alter market dynamics.
Combine technical indicators with fundamental analysis of card values and market structure. No single analytical approach captures all relevant factors affecting trading outcomes.
Continuous Improvement
Trading performance improves through systematic review and adjustment. Regularly evaluate which techniques produce best results for your specific trading focus. Abandon approaches that consistently underperform while doubling down on methods that demonstrate effectiveness.
The most successful gift card traders approach their activity with analytical rigor typically associated with professional financial trading. Technical analysis provides one powerful tool within a comprehensive trading methodology.
Ready to Trade Gift Cards?
Join thousands of users who trust Inwish for safe and convenient gift card trading.
Related Articles

February 23, 2026
How to Convert Home Depot Gift Cards to Cash or Crypto on Digital Exchanges (2026)

February 23, 2026
Google Play Gift Card Region Locks: Cross-Border Trading Rules and Workarounds (2026)

February 22, 2026
How to Save on Foot Locker Sneaker Drops Using Discounted Gift Cards (2026)

February 21, 2026
eBay Gift Card Balance Check: How to Verify, Troubleshoot, and Prepare Cards for Trading (2026)
February 21, 2026
Your First Gift Card Trade on a Digital Asset Exchange: Step-by-Step Walkthrough (2026)

February 21, 2026